An analysis of the own revenues of Himachal Pradesh
Himachal Pradesh was constituted as a centrally administered territory on the 15th April 1948 by merger of 30 odd erstwhile princely hill states. These states had different governance modalities and what came up by their merger was a fairly heterogeneous geographical entity. It was not a single geographical boundary but two land masses separated by territory from the neighbouring States. The State attained a singular geographical boundary in November 1966 when after reorganisation of erstwhile Punjab State, certain areas were added to give Himachal Pradesh its present shape.
After a series of changes in its geographical configuration, it attained Statehood on the 25th January, 1971 to become the eighteenth State of India. Needless to underline, the fledgling State inherited a massive backlog of development due to the feudal administration in the amalgamating princely States prior to attaining of independence. From that bottom of the heap position in the matter of development, it has come a long way on its arduous path of development. In the process, it had to live with limitations of scarce financial resources, surmounting topographic hurdles and living with climatic extremities. But for liberal support from the Central Government, such achievements would not have been possible. In 1948, when the geo-political territory of Himachal Pradesh was constituted, it was the most under-developed entity in the country. Its fiscal capacity was extremely poor due to the fact that erstwhile rulers had precious little concern for enabling creation of revenue raising capacities or improving the socio-economic lot of the common man.
It has been documented at several platforms that the conferment of Statehood on Himachal Pradesh was more in the nature of recognition and fulfilment of the popular aspirations and political ambitions and defining distinctive identity for the hill people in the western Himalayas, rather than the consideration of the fiscal viability of the State as a self-sustaining geo-political territory. Financially, the State could not fend for its developmental needs and the extremely dissected topography coupled with the mountainous terrain and climatic extremities were, and even today remain, formidable constraints in attracting inflow of developmental capital. Simultaneously, these factors also implicitly lead to a slowdown of the pace of development and also limit the development of revenue raising capabilities.
Himachal Pradesh has an area of 55,673 square kilometres. Five major river systems of north and north-western India flow through it. It is also the most rural State in the country with about 90 per cent of its population living in the villages. Most of the towns are like large villages in the country elsewhere. The State is administratively divided into twelve districts. It has over 18,000 villages and 59 urban settlements. Himachal’s social indicators are among the best in the country. It’s per capita income in above the national average.
At the time of formation of State, the fledgling State had a very poor resource base and the principal revenue resource was its forests. This, as one could appreciate, would change in overall national interest and on environmental considerations as the awareness about protecting and intensifying the green cover in the Himalayas gained currency and as we moved on in the time line. In terms of connectivity, the State’s integration with the mainstream remains almost at the same level of evolution as in the beginning in terms of railway connectivity and air connectivity. The only significant development over time has been that it has developed a fairly good internal network of roads to connect its innumerable habitations with the centres of administration and possibly the markets which led to diversification of its subsistence level agriculture by exploiting the natural advantage of altitudes and climate and growing vegetables and fruits.
Due to its very poor financial resources’ base, it was included in the comity of the “Special Category States” from the beginning of the Fifth Five Year Plan (1974-79). By design, the Special Category States would suffer from the problem of chronic revenue account deficits as their revenue receipts would fall way short of the revenue expenditure commitments for regulatory as well as developmental administration. The revenue expenditure commitments would generally be much higher than in the plains States due to easily understood logic that the sparse population density, long distances, difficult topography, severity of climatic conditions and variations in climate, would all add up to push the per capita cost of developmental and regulatory services to a level far higher than the States located in the plains. On the revenue receipts side, considerations like low population density, poor industrialisation, distance from the markets and subsistence level agrarian economy would severely hinder the possibilities of the State to raise resources to improve its revenue base.
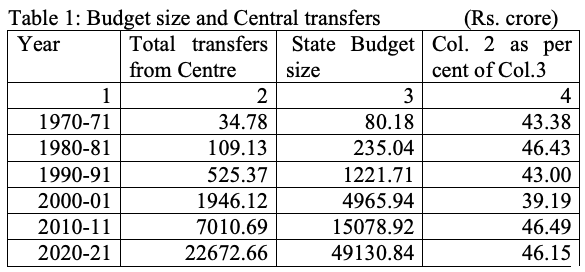
A quick look at the time series data on the quantum of central transfers and the aggregate budget size for Himachal Pradesh will indicate the dependence the State has had on central transfers. The data for a few selected years over time is presented in the following table:-
 Source: Budget documents of the State Government for the respective years.
The above data reveals that the dependence on central transfers of funds has been very heavy. Given the financial resources scenario of the State, it is highly unlikely that it would be possible for it to wean itself away from the situation of over-dependence on the transfer of funds from the Central Government. In the current scenario, the transfers to States are largely through the Finance Ministry based on the recommendations of the Central Finance Commissions.
The economy of the State has followed a natural course of diversification is demonstrated by the following data on changes in the sectoral contribution to State Domestic Product of Himachal Pradesh:
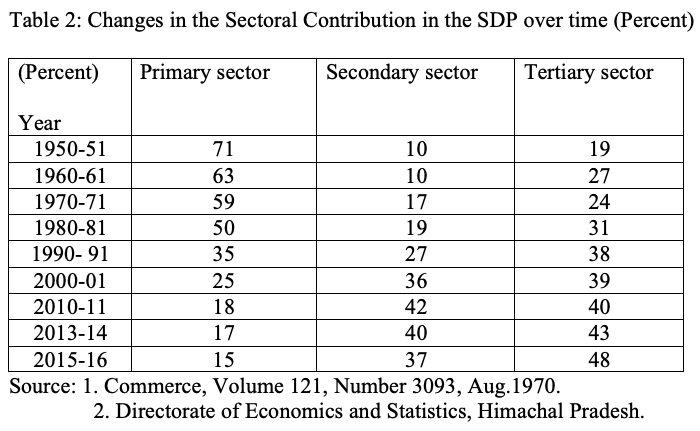
On a theoretical plane, the track of diversification followed by Himachal Pradesh is an ideal text book case, creating a greater scope for generation of financial resources and imparting structural strength to the economy to stay on course of a sustainable high growth path. That despite such a movement of the State Domestic Product, the resource raising capacity is severely limited in Himachal Pradesh would be seen as a function of the low density of population, its consumption needs and allied factors like the overwhelmingly large share of government spending on salaries and pensions in the contribution to the services sector on the one hand, and a large part of the State GDP originating here but accruing of be consumed elsewhere outside the State, on the other.
Himachal Pradesh has been assessed as a revenue deficit State after transfer of the share in central taxes all the way through from the Sixth Finance Commission till the Fifteenth Finance Commission and given the current scenario, it is likely to continue in the same status of being a massively revenue deficit State.
It is of intrinsic interest to look at the changing structure of the State’s revenues, especially between the tax and non-tax revenue sources. The data for the study period is presented below:
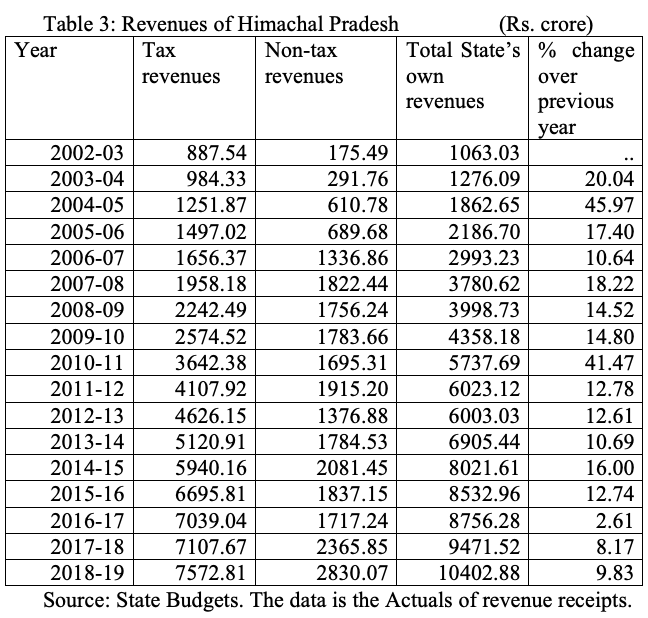
The above data reveals that the relative shares of the tax and non-tax revenues of the State have shown extremely erratic trend over the study period. For the year 2002-03, the tax revenues accounted for 83.5 per cent of the total own revenues of the State and the non-tax revenues constituted only 16.5 per cent of the total. For the year 2007-08, the corresponding shares were of the order of 51.8 per cent and 48.2 per cent, respectively. For 2011-12, these became 72.3 per cent for tax revenues and 27.7 per cent for the non-tax revenues. For the year 2016-17, the share of tax revenues to total own revenues came to 80.38 and the rest 19.62 per cent was contributed by the non-tax revenues. For the year 2018-19, the share of tax revenues to total own revenues came to 72.80 per cent and the rest 27.20 per cent was contributed by the non-tax revenues. It is, therefore, difficult to perceive any trend in the shares of the tax and non-tax revenues at an overall level and use such trend for future forecasting. The quantum increases in the tax revenues witnessed in the first half of the decade 2001-10 were undoubtedly attributable to the introduction of tax reform by switching over from the conventional sales tax to the value added tax. Whether such a significant and sustained increase would materialize after the implementation of the goods and services tax, is a moot question
The trend in the ratios of State’s own revenues to the GSDP and that of tax revenues to the GSDP over the study period does not reveal a progressive picture as would be evidenced by the data in the following table:
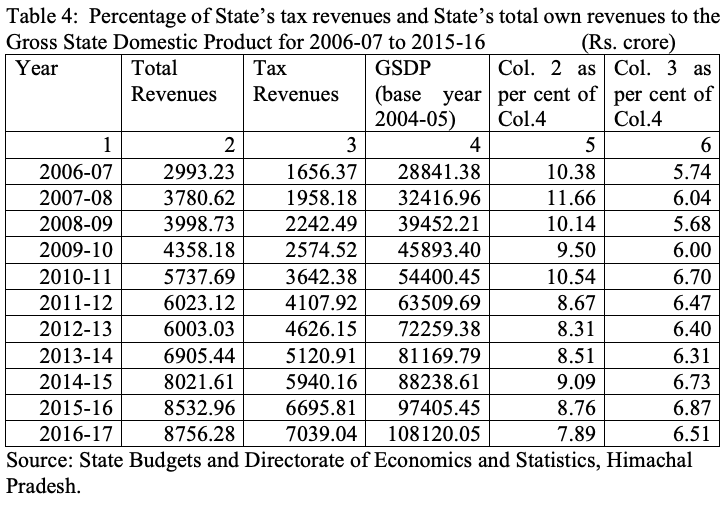 The data presented above does not indicate any trend. The tax: GDP ratio for the State has ranged from 5.68 per cent in 2008-09 to 6.87 per cent for 2015-16 and 6.51 per cent for 2016-17. The reality is vastly different from what the Fourteenth Finance Commission had projected in estimating the yield of State’s tax revenues. The ratio of total own revenues to the GSDP has been even more erratic as it ranges between 7.89 per cent for 2016-17 at the lowest to 11.66 per cent for 2007-08. The unusually jumpy trend in the non-tax revenues is attributable to the revenues from the power sector and its components will be brought out in the following text. The decline in the ratio of total revenues to the GSDP is largely attributable to the jumpy and erratic trend in the non-tax revenues of the State.
As mentioned earlier, forestry sector was one of the principal contributors to the non-tax revenues as also to the State Domestic Product and has declined to insignificant levels in the overall context over time as is demonstrated in the table below:
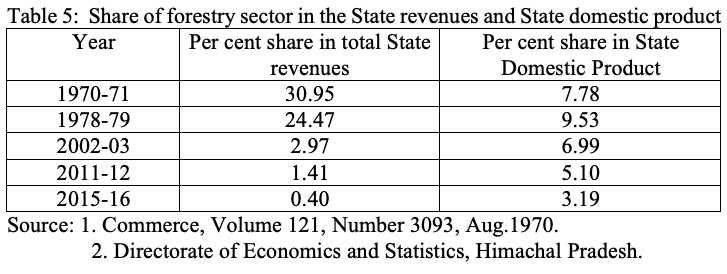 The above data clearly demonstrates that forestry sector is no longer a significant component of the State’s own revenues. It has not only lost its significance in being a major source of revenues to the State, but has also become inconsequential in its contribution to the GSDP. This drastic decline is due to a conscious and far reaching decision of the State Government in 1980-81 when it started the policy of progressive draw down on commercial felling at the rate of 25 per cent per annum to reach 100 per cent moratorium on commercial harvesting from the forests. From 1984-85, the removal from forests has been only in the nature of salvage extraction. Since the forests in Himachal Pradesh lie in the catchment of five major river systems of India, this moratorium has served the overall national interest of flood protection, environmental preservation and conservation of Himalayan ecology as the green cover as also the density of forests have been increasing. For this, it may be high time that some special compensation mechanism is evolved for helping States do this on a voluntary basis. The Fourteenth and the Fifteenth Finance Commissions have touched upon this aspect but it needs a deeper understanding of the issue and a larger financial transfer for the State to continue this policy with combative zeal and serve the national interests.
The other major resource which the nature has endowed the State with is the water flowing in its rivers. This was understood as a major source of revenues through actualisation of the hydro-electric potential from early times in the 1950’s but its exploitation was severely constrained by lack of developmental resources and competing priorities till the end of 1980’s when the State decided to open this sector for private investment. The revenue earning capacity of this sector was further enhanced by the policy of free power to the States where the hydro-electric projects were going to be located in lieu of the stress caused and loss of rights for exploitation by the State in future was accepted by the Central Government in September, 1990. Thereafter, exploitation of power potential stared with accelerated pace and the results started becoming visible. Power sector lately emerged as a major contributor to state revenues in the recent decades only and the pattern of revenues is depicted below:
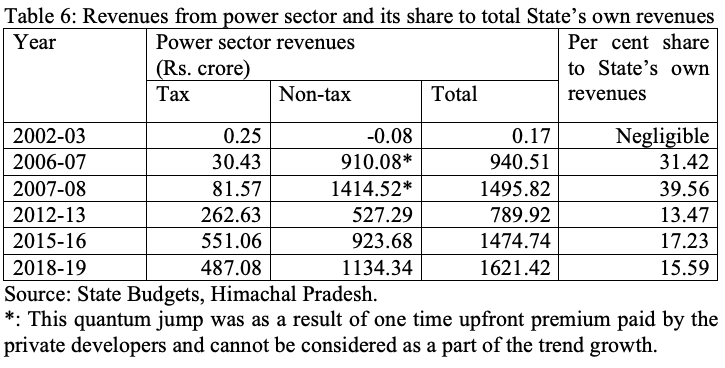 It is important to note that from an inconsequential contribution, the power sector now accounts for a little over one-sixth of the State’s own revenues and this share is likely to stabilise around that level because the growth in consumption of electricity within the State is highly dependent upon rapid industrialisation. It would be relevant to make a mention of the freak years of 2006-07 and 2007-08 when the short-sighted State policy resulted in such one-time bonanza as would never be replicated in future. The future revenue growth will also be determined by the emergence of other sources of energy like solar energy becoming competitive in pricing as also in its ease of exploitation. The revenue would nominally increase in the future hopefully as more and more of the allotted projects come to actualisation and the State starts getting free power share as per the agreements with the independent power producers or the Central/ State utilities.
It is thus apparent that the traditional revenue raising sector of forestry has now become redundant whereas a new avenue has arisen in the power sector which could give sustained revenues over a long term (40 years from the date of commissioning for each project to begin with by way of progressive free power share and thereafter by way of transfer of the ownership of the projects to State). However, the growth in revenues to the State from the allotted power projects has a question mark on its face because the developers are increasingly shying away from investment and early actualisation due to a wide range of factors which include unrealistic power pricing, delayed environmental clearances, local interferences, and difficulty in evacuation of the generated power, among others.
The above macro picture indicates that the possibility of raising revenues by the State of Himachal Pradesh is severely constrained due to a wide variety of factors as have been mentioned in the early part of this chapter. This coupled with the juggernaut of ballooning revenue expenditure on salaries and pensions on the one hand, and increasing burden of interest liabilities, on the other, indicates to a scenario in which the State will increasingly depend upon transfers from centre to sustain itself because it has precious little control on the incremental burden of future pay revisions, dearness allowance and the like. The picture is dismal and disheartening. Expecting a significant mark up in its own revenue raising capacity will be asking for the moon.
Apart from the endowment of natural resources for raising finances for development, for any State to develop and muster resources for development, it must have a sound industrial base and simultaneously should also have the possibility of capitalising on the services sector for combined expansion of employment and incomes. The share of manufacturing activity in the Gross State Domestic Product has witnessed increase over time. Till very recently the industrial base of Himachal Pradesh was very weak. The contribution of the manufacturing sector to the total State Domestic Product in Himachal Pradesh was below 6 per cent till 1970-71 and it grew to 6.9 per cent in 1978-79. A quick look at the share of manufacturing sector in the GSDP would outline the story how incentives worked in promoting a sectoral activity, especially in the backward regions. The time series data on this aspect is exhibited in the following table:
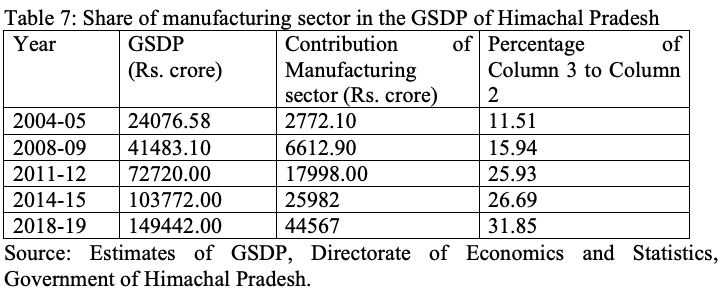 Special incentives for promoting industrialisation were announced and implemented in the year 2003-04 for Himachal Pradesh. The growth of manufacturing sector after these incentives were put in place by the Government of India is clearly visible from the data presented in the above table. There has been a strong showing in the industrial sector in Himachal Pradesh and the share of manufacturing in the GSDP has been rising. This growth also had its impact on the revenues to a certain extent and significant gains in employment were also discernible. The major incentives have since been discontinued but the growth impulses in the sector continue. This opens up the possibility of growth in revenues.
As regards the services sector, the State cannot expect much due to the fact that the same constraint of difficult accessibility by fast means of transport and communications hampers the possibilities in this sector. The growth in the contribution of services sector to the State’s GDP also needs to be analysed. What the government is spending on the salaries and wages and what component of the services sector GDP it comprises needs to be understood. The contribution of the services sector was 24 per cent in 1970-71 and has grown to about 48 per cent for 2015-16. One could surmise that the growth of services sector has been remarkable in the State. However, when one looks into the contribution of government spending on salaries and wages, it emerges that about 22 per cent of the services sector contribution is due to the government spending on salaries, wages and pensions. Analysis of time series data on these two would reveal a very strong correlation between them. It could not be an indicator of real growth of the services sector!
Non-tax revenues of the State will be expected to rise in tandem with the additional capacity installation of hydro-electric installations which are in pipe line as the State will get free power in a progressive manner. For accelerating the actualisation of the allotted potential before it becomes uncompetitive vis-a-vis other renewable sources of energy, the State Government is required to hastily revisit the hydro-electric policy and free it from the constraints and undesirable hurdles in speedy implementation of hydro-electric and efficient evacuation of the generated power.
Before one looks at the performance of collections under various taxes and duties in Himachal Pradesh, it is important to appreciate and keep in mind the changes in the relative share of tax and non-tax sources of revenues in the State as depicted in the following table:
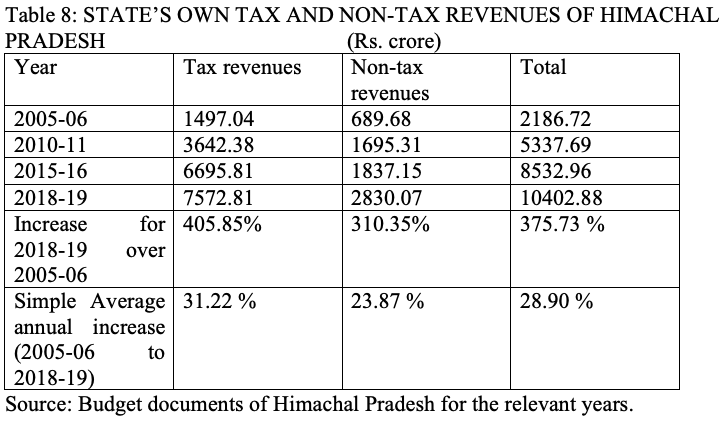 The above data reveals that the growth in the tax, as well as non-tax receipts of the State government, has been strong and robust over the above period under study. The simple average annual growth in the tax revenues was of the order of 31.22 per cent whereas the corresponding figure for the non-tax revenues was 23.87 per cent over the study period. One would like to specifically underline the fact that it was in the year 2005-06 that the State Government realised the growth in revenues, specifically from Sales tax, from switchover to VAT on the one hand, and the non-tax revenues from the free power, sale of power from the state share in various projects and the upfront premium on allotment of hydro-electric projects came to be realised in a significant manner than in the past, on the other. The revenues from power on the non-tax front have peaked in the year 2007-08 and have been on the decline since then. It would also be seen that the growth in the revenues from VAT has been gathering momentum since 2005-06 and continues strongly till the last year under study. Such strong showing of growth can occur from sudden one time impacts and is generally non-sustainable at such high levels over a longer time frame, even though the revenues would keep growing, albeit at a slower level. The other aspect is that the share of tax revenues to the State’s total own revenues was about 68 per cent and that for the non-tax revenues was 32 per cent. In 2015-16, the share of tax revenues rose to 78 per cent and that for the non-tax revenues declined to 22 per cent. For 2018-19, the year for which the actuals are available, the share of tax revenues declined to 72.8 per cent and concurrently the share of non-tax revenues became 27.2 per cent. Going by the immediate prognosis of the scenario, the relative shares of the tax and non-tax revenues are likely to hover around 75 and 25 per cent, respectively, provided the revenues from taxes continue to maintain the same growth.
The trends in the collections from tax revenue sources and the changes in their relative shares are presented in the following table:
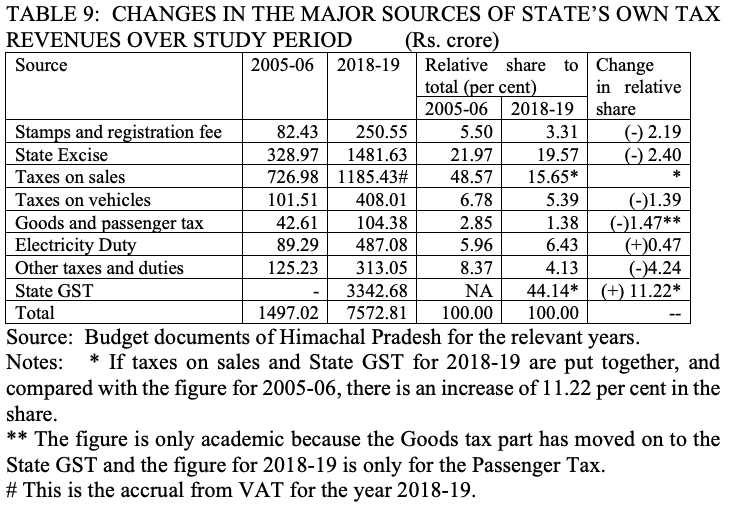
The analysis of relative share of each source has seen a decline except for the taxes on sales and State GST put together as also for the electricity duty. The decline in the relative share of various taxes has resulted from a strong showing in the case of the taxes on sales which accounts for over 62 per cent of the total tax revenues of Himachal Pradesh. There has been a sustained significant increase in the taxes on sales after the switchover from conventional sales tax to the Value Added Tax. One sincerely hopes that the same story could be repeated with the introduction of the Goods and Services Tax. The early signals available so far do not out rightly support this happy thesis.
A look at the time series data on the aggregate revenue collections and the growth trend is necessary to take home the above conjecture. The relevant data is presented in the following table:
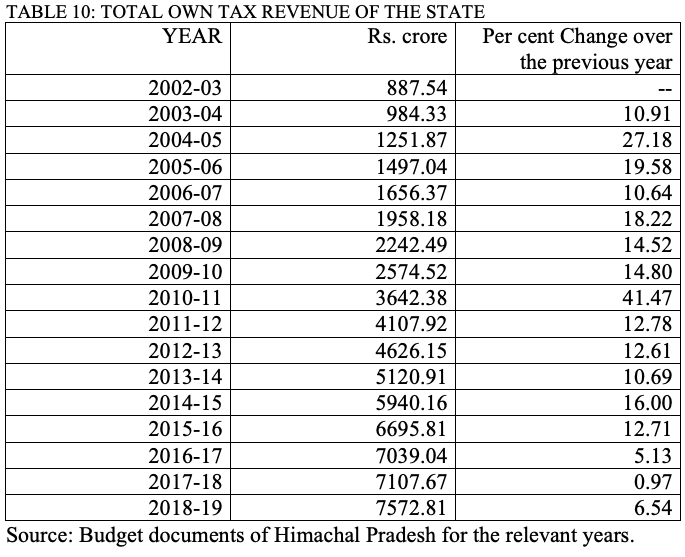 The average annual growth rate of tax revenues of Himachal Pradesh for the period 2005-06 to 2018-19 stands at 14.70 per cent and this represents a realistic estimate of compound growth. The study period has an outlier in the year 2010-11 when the growth over the previous year came to 41.47 per cent. The specific reason for this spike is the revenues from electricity duty as would be seen in the following component analysis. If the outlier is excluded then the average comes to only 12.91 per cent per annum. This, in my perception, could be the realistic rate of growth for revenue forecasting. The basis of this perception is the tardy showing in the revenues from GST. The compensation scheme for loss of revenues from switchover from VAT to GST is now coming to an end. Hence the own tax revenues for Himachal Pradesh could at best be projected based on a 13 per cent growth rate per annum.
An alternative view on future growth could also be taken by analysing the growth rates from individual taxes and then developing a weighting diagram for future forecast. This will be presented towards the end of the article.
Tax effort to GDP ratio is considered an important statistic to measure the efficacy of the tax system towards getting an aggregate projection. The “State’s own tax collection to GDP ratio” for the study period is presented in the table below:
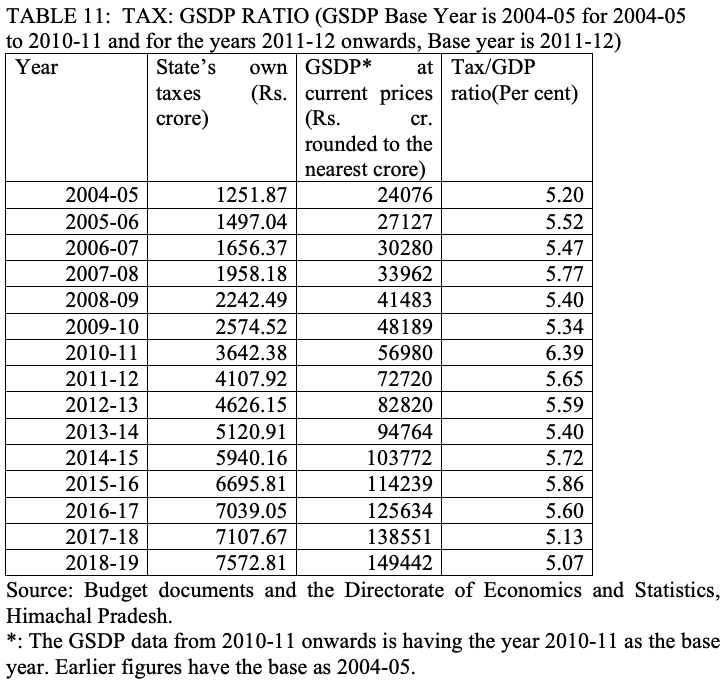
Tax collection as a percentage of the GSDP is an indicator which singularly explains the efforts of the State Government to garnish financial resources for running the affairs of the State. The above data indicates that the tax effort as per cent of the GSDP at current prices has ranged between 5.07 in 2018-19 to 6.39 in 2010-11. The decline in the percentage of tax effort to GSDP in the recent years is clearly indicative of the fact that there has been a deceleration in the tax effort. Successive Finance Commissions have used this statistic to forecast the tax revenues of the States and generally the States, specifically the so called special category States have fallen significantly short of the projections leading to yawning revenue deficits. Hence, infeasible normative projections of tax revenues of the States in general, and for mountain States having poor fiscal capacity, in particular, has historically ended up being far removed from reality and faults the design of Article 280 of the Constitution of India to balance the revenues and expenditures of the States and the Union Governments.
The Goods and Services tax was introduced in the year 2017-18. Although the tax to GSDP ratio has been fluctuating, it has nose-dived from 2016-17 and has touched the lowest level of 5.07 per cent. It is likely that the ratio will further decline in the immediate years to come.
Consistently growing tax revenues coupled with near stabilised population growth point to the fact that per capita tax revenues in Himachal Pradesh have grown faster than many States. Therefore, it goes without saying that on a comparative basis, Himachal Pradesh has a more efficient tax system than the Special Category States on the one hand, and as compared to the all-India average, on the other. It, however, needs to be remembered that the increasing per capita revenues are also a function of the population growth. Himachal Pradesh has contained the population growth more effectively than most States of the country and hence the growth in revenues has a slow growing denominator to result in higher growth in per capita revenues. Consistently high growth rates do not sustain for long periods and are also impacted by special conditions like industrial promotion incentives in the State in the past decade and spurt in the exploitation of the untapped hydro-electric potential in the State. The incentives have since been discontinued and the allotted power potential is yet to be actualised. It is, therefore, implicit that the growth rates of revenues might plateau out in the coming decade.
Keeping in view the fact that the per capita incomes in the State are rising at a rapid rate as compared to many States in the country, such a rise should either result in incremental consumption leading to better tax collection or should lead to rapid rise in saving rate and capital formation. There is precious little evidence that any such phenomenon is manifesting itself in the economy of the State. This should be an area of study for the economic and financial administration in the State.
Coming to the individual tax items, the stamps and registration fees account for about 4 per cent of the total own tax revenues of the State. The time series data for 2005-06 to 2018-19 on this item is presented in the table given below:
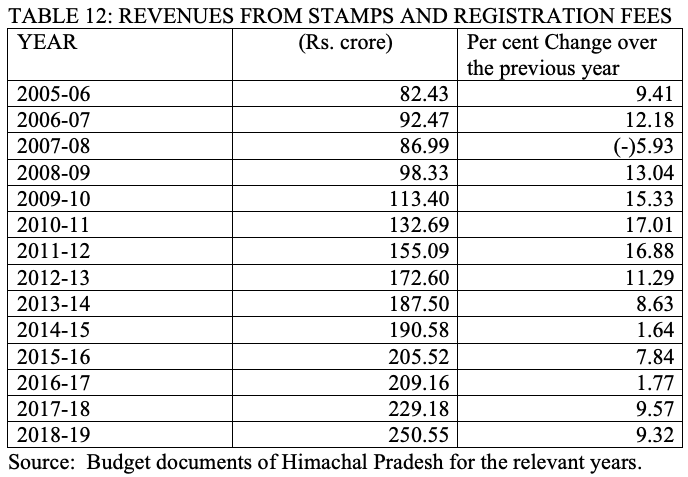
The collections from stamps and registration fees have grown at an average growth rate of 7.66 per cent per annum during the study period. Discussion with the officials of the Industries and Power departments revealed that the spurt in land transactions was a result of the liberalised industrial incentives in the early part of the study period and the trend appeared to have not only plateaued but is on the decline. Future growth in the realisation from the stamps and registration fees would be from the normal land transactions and registrations and the growth tempo of 2008-09 to 2011-12 may not be sustained into future. Given these facts, the growth rate of about 8 per cent in this item would seem optimistic and reasonable for the purpose of forecast in the weighting diagram.
For the year 2018-19, the State excise duties account for about 19.56 per cent of the State’s own tax revenues. Collections from State excise are an important source of revenue. The time series data for the study period is presented below:
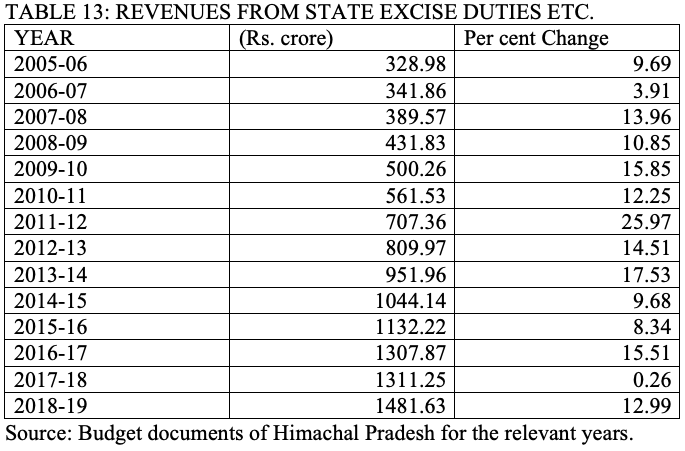 The average annual growth rate for the study period for State excise revenues works out to 12.23 per cent. Given the constraints of regional parity in the excise rates to avoid diversion of trade and unfair practices, the revenue growth in this item would remain a bit suppressed in the future. The consumption of alcohol is a function both of the per capita incomes and climatic requirements and the increase in population. Per capita income of the State is above the all-India average and according to an old study by NIPFP, Himachal Pradesh ranked 7th highest in per capita liquor consumption in the country.
Effort made to analyse the high growth trend in the years 2009-10 to 2011-12 revealed that the growth came about as a result of quota enhancement of all excise commodities e.g. country liquor, Indian made foreign spirits and beer on the one hand, and across the board revision of the levies and license fees, on the other. The extent of additional resource mobilisation in 2010-11 was of the order of Rs. 55.89 crore and that for the year 2011-12 was Rs. 171.14 crore. These measures resulted in an average growth rate of about 14.6 per cent during 2009-10, 2010-11 and 2011-12. The growth in 2012-13 over 2011-12 has been of the order of 14.51 per cent which appears to be the overhang effect of the additional resource mobilisation measures of 2011-12. Therefore, it would be optimistic to assume around 12 per cent growth for the purposes of future forecast of revenues from this important levy. It needs to be kept in view that the population growth has been slowing down in the State and the prices of various brands of alcohol have reached an inelastic level compared with the prices in the region.
Taxes on sales account for about 59 per cent of the total State’s own tax revenues. This, therefore, is the biggest contributor to the State’s revenues. As was mentioned above, there has been a significant increase in the collections from this source of revenue after introduction of the value added tax. This fact has strengthened the viewpoint that the extent of evasion under the old dispensation of State’s sales tax was considerable or the collection was poor. Movement to the Value Added Tax led to significant improvement in tax compliance and plugging of leakages. Data for the study period on the collections from taxes on sales is depicted below:
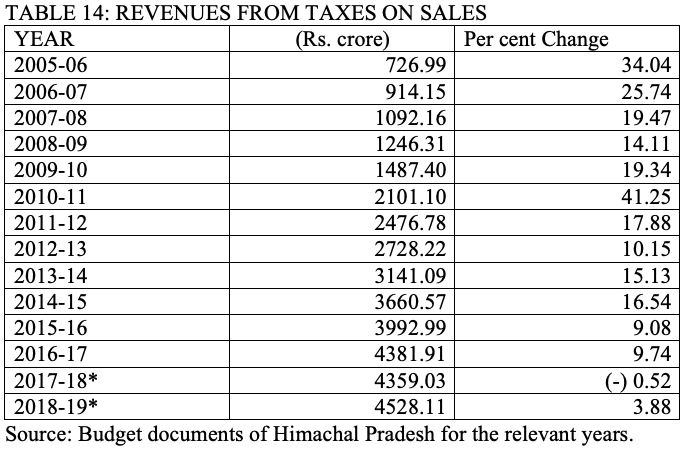 The average annual growth rate for the study period in the collections from taxes on sales has been of the order of 7.74 per cent. It is, however, important to see the components of unusually high rates of growth for some years in the time series data. Growth rates of 34.04 per cent in 2005-06 and 25.74 per cent in 2006-07 resulted from the switchover from the traditional sales tax to Value Added Tax and the industrial concessions announced by the Government of India for a period of five years in terms of central excise duty and income tax exemptions. Subsequently, similar spurt in growth was not sustained as is evidenced by the data. Another abnormal year is 2010-11 with a growth of 41.25 per cent over the previous year. This resulted from introduction of entry tax with effect from 8th April, 2010. The rates for this levy were raised from 4 per cent to 5 per cent in March 2010 and from 12.5 per cent to 13.75 per cent in July, 2010. The single year increase in the collections was of the order of Rs.117 crore which could not be sustained in the coming years. Introduction of VAT also resulted in considerably raising the number of registered dealers in the State. Between 2006-07 and 2011-12, the number of dealers increased from 39980 to 60558, an increase of over 50 per cent. The number of dealers for 2011-12 was 61835, an increase of about 2 per cent over the figure for 2010-11. The number of dealers for 2015-16 stood at 62549 and increased to 70065 for 2017-18. It is early days to make a comment on the number of dealers who will get under the umbrella of the Goods and Services Tax reflecting the improved compliance. The latest data indicates that the number of dealers registered under the Goods and Services Tax is 92651. Because of these explanations, it would not be realistic to assume a growth rate for the forecast period based on the average growth of revenues from taxes on sales. The trend in the last five years of the study period is a pointer to take the projections for the future forecast at about 8 per cent per annum.
Taxes on vehicles account for 3.97 per cent of the total State’s own tax revenues for the year 2015-16. The time series data on this item of taxation is depicted in the following table:-
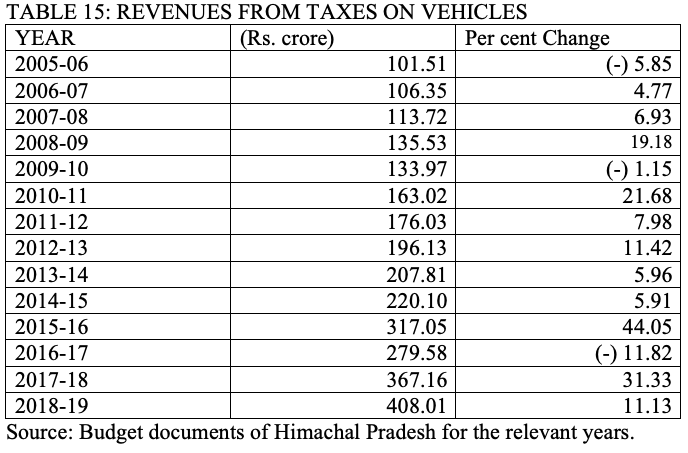 As is evident from the above data, the revenues from taxes on vehicles do not exhibit a consistent pattern of growth. The average growth rate for the study period comes to about 12 per cent per annum. Given the erratic trend over the last 10 years, it would be safe to assume a growth rate of 12 per cent for taxes on vehicles for the purposes of future forecast.
Another important area of taxation is the passengers and goods tax for which the time series data for the study period is given in the following table:-
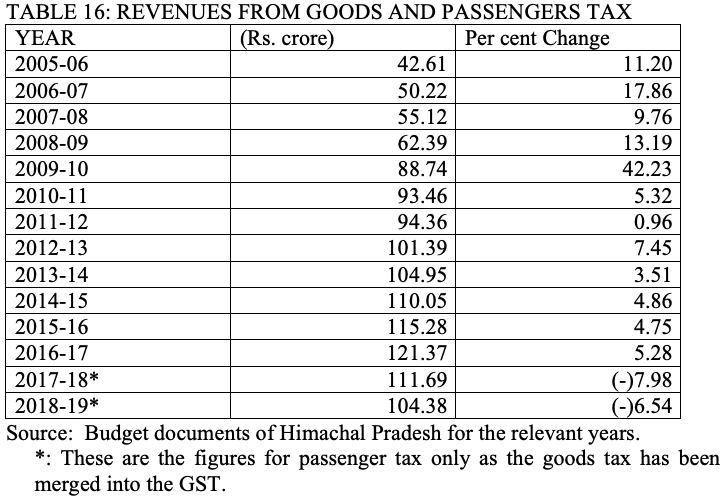 Whereas collections for all the years except for 2009-10 appear to fall into a pattern, the collections for 2009-10 are indicative of an unusually high growth of 42.5 per cent over the previous year. Further data mining from the collecting agency revealed that there was a realisation of one time arrear of about Rs. 8 crore due from the State Road Transport Undertaking during the year; and enhancement in the rates of additional goods tax on items like conductors and aluminium wires, lime stone, fly ash, iron and steel and plastic goods in the range of 40 to 50 per cent effected in February, 2009; and the rates of goods tax were also enhanced in the range of 18 to 24 per cent effective from October, 2009. These measures resulted in this spiking of the collections which cannot be sustained into future.
Based on the data presented above, the average annual growth rate for passengers and goods tax for the study period works out to 8.85 per cent even after inclusion of the outlier growth rate for 2009-10. It accounts for only 1.72 per cent of the State’s own tax revenues for the year 2015-16. Based on this average, it would be fair to assume a growth rate of 9 per cent for this item for the purposes of future forecast
Electricity duty has lately emerged as an important source of revenue as its share in the total own tax revenues has increased from 0.03 per cent in 2002-03 to 5.28 per cent in 2015-16. The revenues from electricity duty are a function of the electricity consumption within the State and not of the aggregate generation of electricity in the State. The total energy sale within the State has increased from 3640.85 million units in 2002-03 to 6918.16 million units in 2011-12, and further on to 7951.09 million units for 2015-16. It is likely to increase at the same tempo in future due to the domestic supplies being subsidised by the State Government. Another possibility of increase in the revenues from electricity duty is increase in the rates of duty. However, the actual revenue accruals on electricity duty for the study period are presented in the following table:-
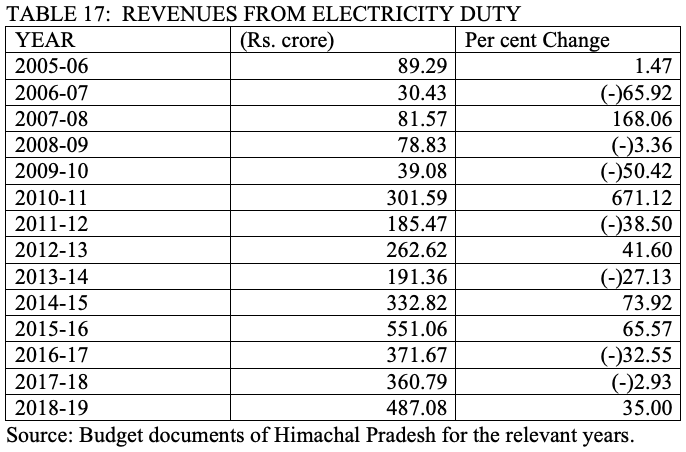 The above data indicates an extremely erratic pattern of revenue accruals from electricity duty which cannot be used as a basis for forecasting revenues on this account into future. The erratic trend is entirely due to the fact that the HPSEBL – the electricity utility responsible for distribution and sale of energy collects the electricity duty from the consumers but does not pass on the actual collection to the State Government on a year to year basis. Considering the pattern of increase in the actual quantum of energy sales within the State, it would be safe to assume about 10 per cent growth rate. The future increase in the revenues from electricity duty is highly dependent upon the future pace of industrialisation. With the closure of tax holiday in industries sector in Himachal Pradesh, the likelihood of sustained increase in revenue accrual from electricity duty becomes weak.
All other tax levies have been proposed to be grouped as “Other taxes and duties” and the data on this lump for the study period is presented in the following table:-
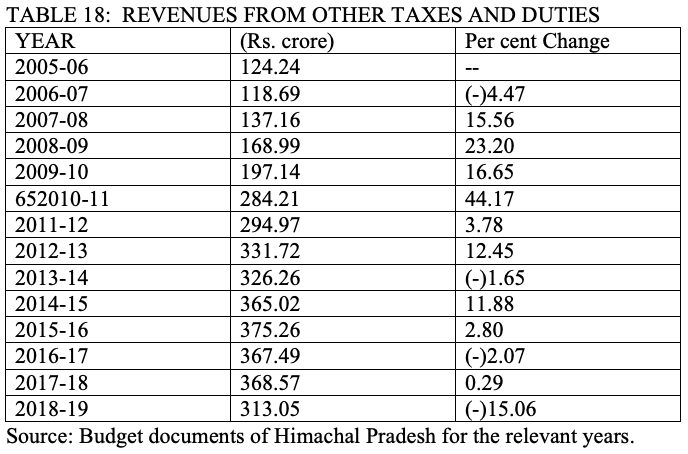
The average growth rate for other taxes and duties for the study period works out to 8.15 per cent. As the data clearly exhibits, there is no discernible trend in the revenue collections under this lumped category. For the purposes of future forecast, it would be safe to assume a growth rate of 8 per cent.
Based on the factor analysis of the growth rates for various sources of tax revenues, it would be interesting to look at a weighted average of the growth in tax revenues because the Finance Commissions usually assume a singular number for the growth rate for total tax revenues during the forecast period. The picture is presented in the following table: –
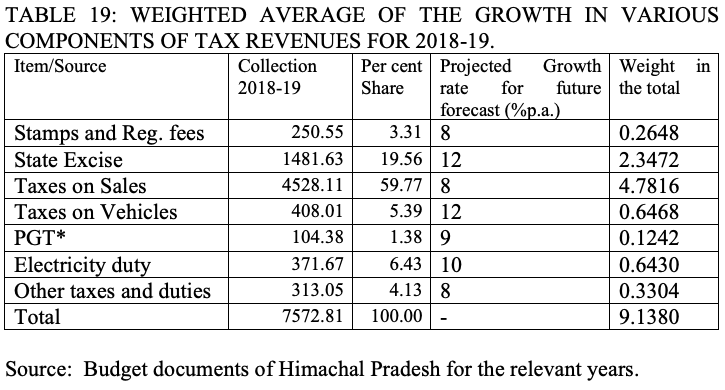
The weighted average on the above basis works out to 9.14 per cent. For the purposes of future forecast, one can safely assume about 9.25 per cent per annum growth in the aggregate own tax revenues of the State. Given this scenario, the revenue deficit of the State will rapidly increase unless the unabated ballooning of the expenditure is contained. With the increase in the revenue deficit, the pressure to borrow will increase on the one hand, and diversion of borrowings for investment in capital formation will occur with greater severity, on the other. The total picture will be redrawn at the end of this article after taking a view on the non-tax revenues also.
As mentioned earlier, the traditional major source of non-tax revenues in Himachal Pradesh used to be the forestry sector but due to proactive policies for environmental conservation of the fragile Himalayan eco-system followed by the Government of Himachal Pradesh starting early 1980’s, this has become an insignificant contributor to the non-tax revenues of Himachal Pradesh. Simultaneously, the State share in Nathpa Jhakri hydro-electric project, free power revenues from various projects commissioned in the post-1990 period and other revenues accruing to the government by way of upfront premium on allotment of projects to the private developers have very significantly contributed to the non-tax revenue base of the State, even though some of these have been one-time events with no possibility of recurrence into future. It, however, needs to be understood that once the potential of hydro-electricity in the State is realised, the future growth will only come through the increase in the rate of sale of electricity.
Let us take a look at the growth of total non-tax revenues of Himachal Pradesh over the study period. The data in this behalf is presented in the following table:-
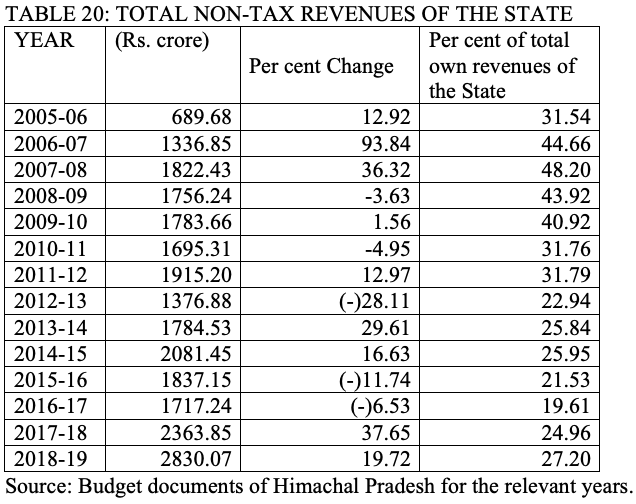 Above data clearly exhibits that the relative share of the non-tax revenues to the total own revenues of the State has significantly declined over time during the study period. The two major factors which are responsible for this decline are the forestry revenues becoming insignificant and the power sector component tapering off to the natural levels after spikes of one-time accrual of upfront premium on allotted projects. The share of non-tax revenues to total own revenues peaked at 48.2 per cent in 2007-08 and came down to only 19.61 per cent for the year 2016-17. This decline points to limiting possibilities of revenue raising from non-tax sources because one-time revenue accrual from allotment of power potential by way of upfront premium will not be repeated. The above data also reveals that the annual growth rates observed in the total non-tax revenues are erratic and do not indicate of any trend. This has happened due to the fact that the revenues from power sector have been fluctuating widely and violate the trend analysis. The components of the aggregate of the non-tax revenues need to be individually gone into for each source to understand the trends, if such trends exist at all. It would not be reasonable to assume a growth rate for the entire aggregate and therefore, one should look at each one of the sectoral components of the non-tax revenues of the State to see if trends in major contributors could be used for future forecast.
Hydro-electricity has been mentioned as the prime resource of Himachal Pradesh for over half a century. Its exploitation did not gather the desired momentum till 1990’s. The pace of exploitation has picked up after that because of opening up of the sector to the private investment. It may be of significant interest to look at the status of hydro-electric potential in the State as of now. Out of this, about 4200 MW potential is nowhere on the drawing board so far. The data in this behalf is presented in the following table: –
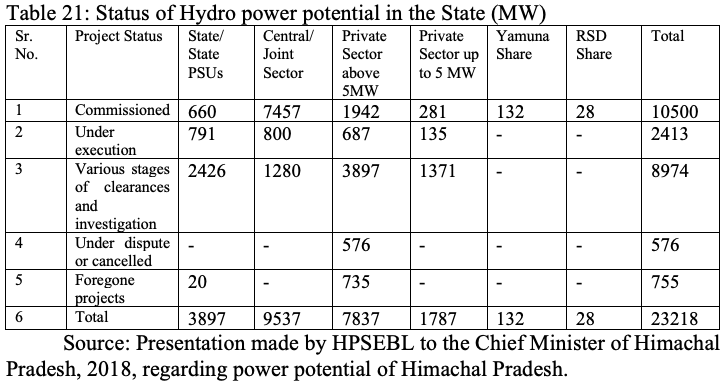 It may be seen that of the total potential exploited so far, about 71 per cent is owned by the central sector or Centre-State joint ventures. The State Government does not get 12 per cent free power on about half of this actualised capacity because these installations were commissioned prior to September, 1990, when such a principle was conceded by the Central Government. On the remaining capacity, the State gets 12 per cent free power in eternity. Under the private sector, there are installations adding up to about 1300 MW out of 2223 MW on which the State Government will get 12 per cent free power in eternity. On the other private sector projects, the State will get free power on an incremental scale as explained in the following text. The free power revenues are not on the installed capacity but on the aggregate bus bar generation on a year to year basis which implies that such revenues are highly dependent upon hydrological fluctuations on a year to year basis. The increase in revenues from free power in future will come from projects in pipeline aggregating to about 9000 MW. Of this, a possible capacity addition of 3706 MW lies in the State or State and Central joint venture projects on which the free power will accrue to an extent of 12 per cent of the generation during 2020-25 period subject to installation of this potential. Projects aggregating to 5268 MW stand allotted to the private sector. A sizeable component of this potential is highly unlikely to be realised because of extremely unrealistic free power promises made by the private investors at the time of allotment via the competitive bidding route. The reason for this statement is that such projects will not become financially viable under any circumstances of energy pricing and evacuation constraints. Given this fact, the forecast of non-tax receipts from this source needs to be made on a realistic basis and not on trend growth or any unrealisable assumptions.
In the overall context, it is important to see that the accrual from the power sector has been the major contributor to the non-tax revenues of the state and the following data underscores the context: –
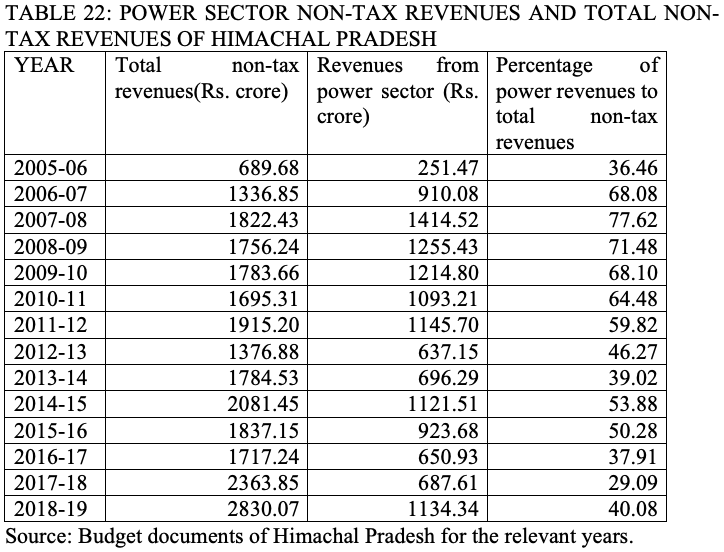
It can be observed from the above data that the share of power sector revenues to total non-tax revenues has fluctuated between about 36 per cent for 2005-06 to about 78 per cent in 2007-08. It has since been falling and came down to about 39 per cent for 2013-14. The revenues from power sector have peaked in the period 2006-07 to 2010-11 and are unlikely to regain the same levels of growth or realisation because of the upfront premium for various projects being a one-time accrual and about 98 per cent of the total assessed potential already stands allotted. Also, the rate of sale of energy has been fluctuating and fallen significantly due to additional capacity coming up in the northern region States.
The data above shows spikes and dips in revenue accrual from power from 2007-08 to 2018-19 but the share of revenues from power appears to have stabilised around 50 per cent of total non-tax revenues till 2015-16 but has since declined to under 40 per cent.
One would observe that there has been a spiking of the revenues from power during the period 2007-08 to 2009-10. This has resulted from upfront premium on allotment of projects, high rates of sale of power in the initial years and availability of free power from the new generating utilities coming into being. After 2007-08, the accrual has seen a downward trend continuously. The reasons for this slide are as follows: –
1. The surge resulting from collections through the payment of upfront premium by the private developers or IPPs has since abated and there are no fresh accruals now onwards.
2. The rate of sale of power has seen a steep decline in the region due to additional generation capacity coming up in the region severely affecting the revenue accrual to Himachal Pradesh.
3. There has been a deceleration in actualisation of additional generating capacity and resultant free power availability to the state as against the anticipations of faster installation of additional capacity due to a slump in the national economy and certain unforeseen delays in project execution.
Given the above scenario, it would be prudent to assume a growth rate of 10 per cent per annum in revenues from power sector for the purposes of future forecast.
As mentioned in the foregoing chapter, forestry sector has ceased to be a major source of revenue as it used to be in the earlier years after formation of the State. The data below indicates the actual collection over the study period:-
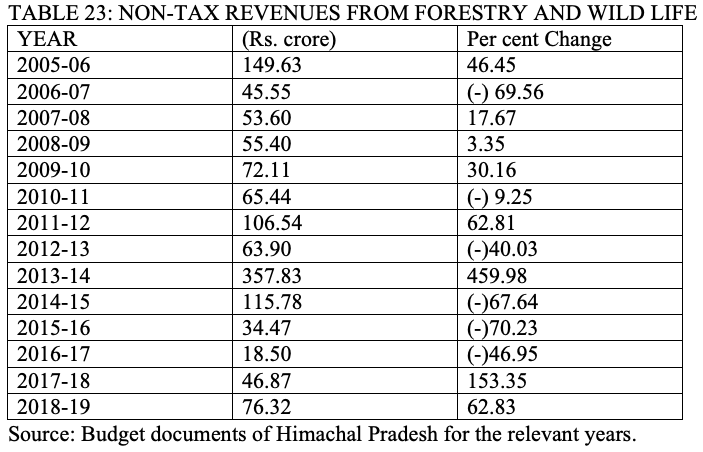
The forestry revenues constitute only 1.87 per cent of the total non-tax collections for 2015-16 and account for 0.4 per cent of the State’s own revenues. Any assumption of future growth in this sector will be misplaced as the policy of the State is to restrict the removals from forests to salvage extraction only. It would be fair to assume that the revenues will behave to stay at the constant level in future as green commercial felling shall not be taken up. A greater purpose will be served if an assumption of zero revenues from forestry for Himachal Pradesh is taken for future.
Royalty on minerals is another important area of non-tax revenues. The data on this aspect is tabulated below for the study period:-
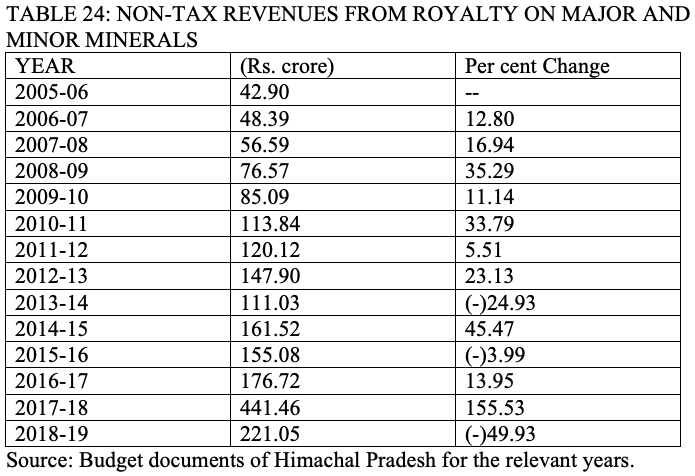
Accruals to the royalty on minerals largely come from limestone in Himachal Pradesh. The authority to revise the royalty on major minerals of which limestone is one, vests in the Central Government. The royalty rates for limestone were last revised in 2009-10 by the Government of India leading to an unusually high growth rate for 2010-11 over 2009-10. The spurt is seen to have levelled off for 2011-12. For 2014-15, the revenues have again shown significant increase. The trend average growth rate for the above data will be difficult to be assumed for future forecast because of extremely erratic trend. Since the chances of any growth from minor minerals are remote given the environmental over-enthusiasm, it is felt that the forecast assumption for future would be closer to reality if assumed at about 10 per cent. Higher level of revenues can accrue if the rates of royalty are revised by the Central Government or new cement plants come up. Needless to say, new cement plants are not any longer in fashion, especially for fragile eco-systems like Himachal Pradesh.
All other non-tax revenue receipts belong to the areas of general services, social services and to a limited extent to economic services like irrigation. Education and health account for a lion’s share of public spending in the State but the cost recovery from these services is negligible as these are considered free of cost services. Similarly, the drinking water supply in the rural areas is a nearly free public good and recovery mechanisms do not even cover a small part of the operation and maintenance costs. In the urban areas, the cost recovery for drinking water barely covers about 8 to 10 per cent of the cost. The operation and maintenance costs for irrigation and drinking water are prohibitively high and make the task of actual cost recovery of these services impossible. Lumped together, the revenue accrual from these areas for the future forecast could be best assumed around 7 per cent.
Given the above scenario, the non-tax revenues of Himachal Pradesh for the purposes of future forecast would behave in a static manner, indicating no sustained pattern of growth. The weighted average for the growth in non-tax revenues based on the average figures for the latest two years works out as under:
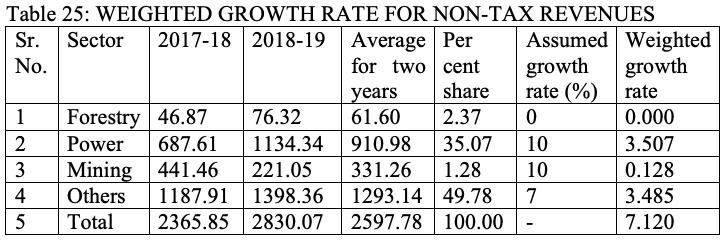
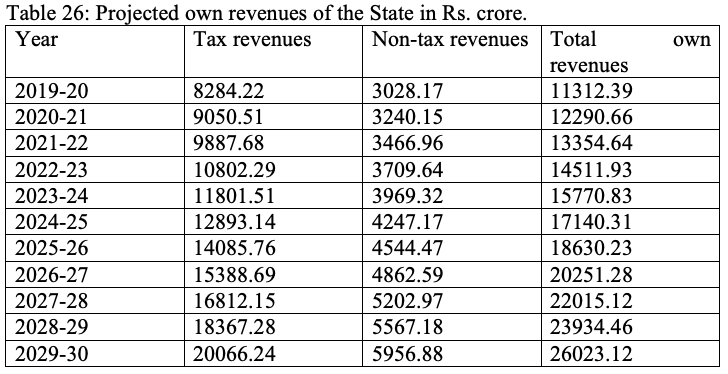
Keeping the above table in view, the non-tax revenues could be blown up for the purposes of future forecast at an annual growth rate of 7 per cent. Projected tax and non-tax revenues on the above basis for the future years are presented in the table below:
 Against these projections for own revenues, let us have a look at the three components of committed revenue expenditure, namely salaries, pensions and interest payments. These have been growing at the rate of 10.44 per cent, 17.30 per cent and 8.77 per cent per annum during the years 2010-11 to 2018-19. The growth rate for pensions needs to be moderated for an outlier figure of 56.13 per cent growth for 2010-11. The moderated figure comes to 12.37 per cent. Based on these growth rates, the projections for the coming decade are given in the following table:
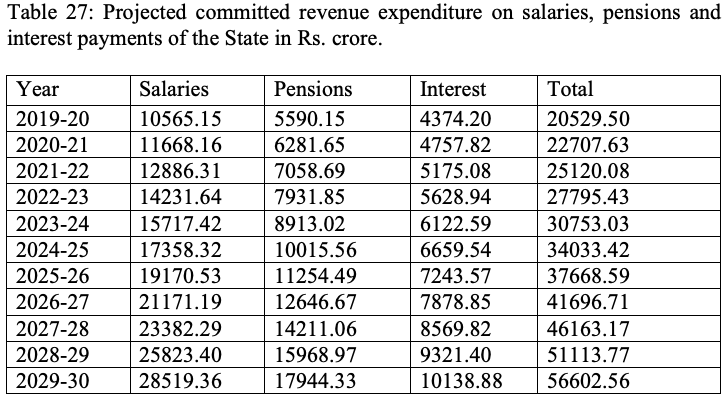
The figures in the last column of the tables 26 and 27 above indicate that leave alone covering the total revenue expenditure of the State by its own tax and non-tax revenues, these do not even cover the committed expenditure on salaries, pensions and interest payments. One would argue that the State receives share in central taxes through the Finance Commission dispensations and also the revenue deficit grants to cover the gap left, the reality is that it does not happen in totality and certain part of the revenue deficit remains uncovered even after diversion of capital receipts to foot the bill for committed revenue expenditure. Thus the State is left with no option but to use the borrowings for meeting revenue expenditure rather than building capital assets. The revenue deficit tends to widen, the fiscal deficit tends to increase, the debt burden also simultaneously increases and the State finances head to get into a debt trap. The compliance reports of the FRBM Act are tabled in the State Legislature but re rarely looked at and never discussed. With the Central Government commanding a larger share of the sharable pool of tax collections, the slice for the States continues to get smaller and the shares tend to shrink far beyond expectations. The future, given these facts, seems gloomy rather than brightening up. Also, the danger of erosion in the capital stock of assets due to poor upkeep and maintenance looms large.
A brief comment on the suggestions for enhancing the revenue productivity of the State needs to be made keeping in view the limitations or constraints. As has been mentioned earlier, the tax on sale of goods or the VAT accounted for over two third of the total tax revenues of the State. Various Acts the taxes under which have been subsumed in the Goods and Services tax include the State Value Added Tax Act, 2005; the State Entertainment Act, 1968; the State Entertainments Duty Act, 1968; the State Tax on Luxuries Act, 1979; and the State Tax on Entry of Goods into Local Area Act, 2010. With these having been subsumed into the GST, the only potential areas of raising revenues which remain with the State are Excise and Electricity Duty. The growth in excise revenues is severely limited by the regional environment and the tax regime prevailing in the neighbouring States. Similarly, the growth in revenues from electricity duty is entirely dependent upon the levels of consumption of electricity within the State. This potential area of revenue raising is also severely constrained for possibilities of growth due to the fact that the State attained universal electrification of households and the energy consumption has lately been rising slowly in the domestic sector. Large scale growth can come from expansion of industrial activity and the share of manufacturing sector has been showing strong growth. One can hope similar growth comes up in the revenue contribution from the manufacturing sector.
As regards improvement in the non-tax revenue collections, the details have been given above. Given these facts, the only possibility of raising revenues into future lies in the domain of the Goods and Services tax. The available data on GST collections, however, indicates sluggish growth in short term and decline in revenues after the regime of protected revenues comes to an end.
Given the above scenario, the State of Himachal Pradesh seems to have a very difficult fiscal future and it will become increasingly difficult for the State Governments of future to make both ends meet even for matching the committed expenditure. Theoretically, the solution lies in compression and containment of the expenditure-specially the committed expenditure on salaries, pensions and interest payments on the one hand, and raising revenues innovatively by raising rates wherever possible, raising levies in such a manner that the poor are spared and widening the tax net, on the other.
*********
Devinder Kumar Sharma, a former Principal Adviser and Secretary Planning, Government of Himachal Pradesh, is a visiting professor and an economist. He lives in Shimla. The audio in Wanted Dead or a Wild uses tense guitar riffs and gunshot effects to reinforce the Western setting. Hacksaw Gaming crafted the soundscape to mirror the slot’s pacing, with quieter moments between bonus bursts. Any https://wanteddeadorwildgame.com/ casino where you play will benefit from using quality headphones to catch the details.
